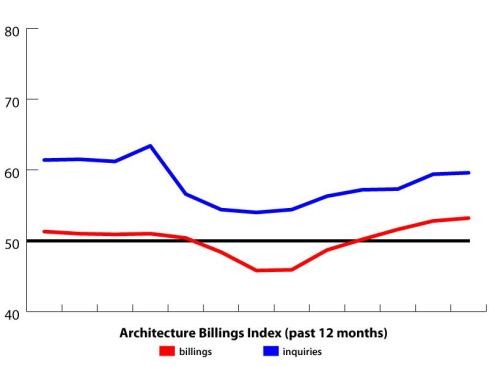
Last month, for the fourth straight month, demand for architectural services grew, according to the American Institute of Architects’ Architecture Billings Index for November. The national score for architecture billings came in at 53.2—the highest score since November 2007—up from October’s 52.8. Each of the past two years also saw a similar five-month run of growth in billings, but each of those began in November and ended in March. This year, billings began to grow in August and have yet to slow. If the trend continues through March, as it has the past two years, then that will mark eight straight months of growth. In addition, similar to how the U.S. Department of Labor’s Bureau of Labor Statistics (BLS) revises its monthly employment figures, the AIA revised its past months’ data. For October, the commercial sector was revised up, above 50.0 (the breakeven point between contraction and growth), which resulted in all sectors and all regions showing growth in business for that month. The industry hasn’t seen a perfect slate such as this since July 2007.
November also sees the Project Inquiry Index at 59.6, which marks the 47th straight month in which inquiries into architectural services has been increasing. All of the industry’s sectors are growing, and all have grown for at least the second consecutive month. In addition, all regions except the West are continuing to grow, again for at least the second month in a row.
We will be watching to see if the upward swing in business continues or if the industry cools off again come spring, as has happened for the past two years. But if you combine this data with the BLS’s employment reports that showed 2,400 architectural and engineering jobs added to the economy in November and 1,500 in October, you can see cause for hope.
National Highlights:
Billings: 53.2 is the highest score since November 2007 (55.1) , and this is the fourth straight month above 50.0.
Inquiries: 59.6 is the highest score since February (63.4), and this is the 47th straight month above 50.0.
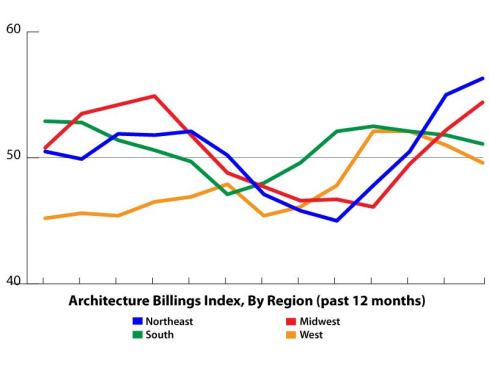
Regional Highlights:
Northeast: 56.3 is the highest score since December 2007 (58.4), and this is the third straight month over 50.0.
Midwest: 54.4 is the highest score since February (54.9), and this is the second straight month above 50.0.
South: 51.1 down slightly from the 51.8 in October, but this is the fifth straight month of growth for this region.
West: 49.6 makes this the only region in contraction, and the first score under 50.0 for the West since July.
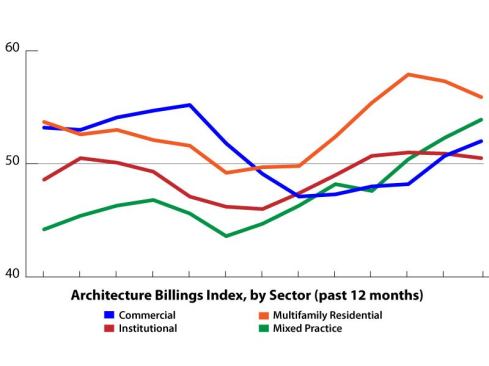
Sector Highlights:
Multifamily Residential: 55.9 is down from October’s 57.3, but this is the fifth straight month of growth.
Mixed Practice: 53.9 is the highest score for this sector since November 2007, and represents the third straight month of growth for the sector.
Commercial: 52.2 is up from October’s (revised) figure of 50.7.
Institutional: 50.5 is down slightly from last month, but still represents the fourth straight month of growth.