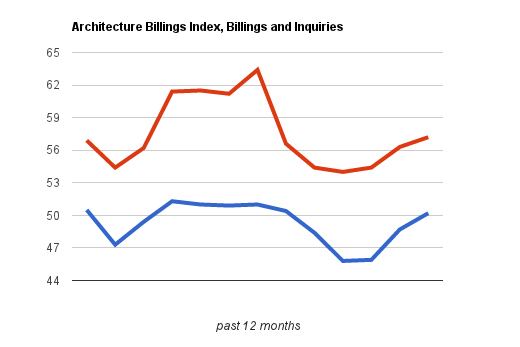
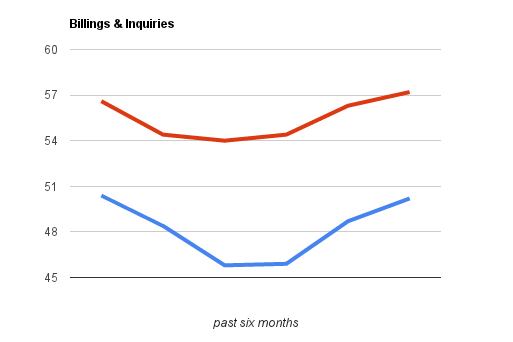
Nationwide, demand for architecture work is finally growing again. For the past four months, the American Institute of Architects’ Architecture Billings Index has reported a slowdown in architecture billings. With a score of 50.2, the Architecture Billings Index is finally above the breakeven point of 50 again, for the first time since March. The nadir for billings this summer came in May at 45.8. Inquiries about new projects also grew, to 57.2 from last month’s 56.3. While not as robust as the numbers from last fall and winter, these nevertheless show an industry that is growing again, albeit slightly.
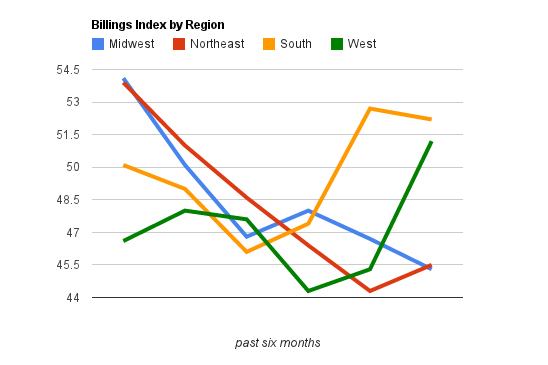
In addition to the nationwide numbers, the scores for the four regions and four sectors were mostly improved in August as well. (Each of these, unlike the national figures, is calculated as a three-month moving average.) The South continued to grow, and its 52.2 is the highest score for the region since December 2011. This was joined by the West at 51.2, that region’s highest score since August 2007 and its first positive score since that month as well. The Northeast moved up to 45.5, inching back towards positive territory. The Midwest, meanwhile, sunk to 45.3, that region’s lowest score since October 2009.
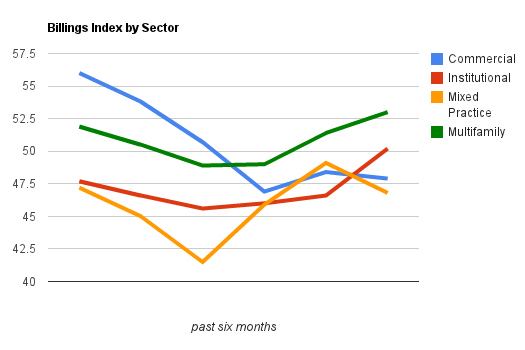
Of the four industry sectors, Multifamily Residential remained in positive territory, increasing to 53.0, the highest since January. (Along with Commercial, this sector has been one of the strongest since the financial crash in 2008, and continues to be so.) Speaking of the Commercial sector, it continues to move back towards 50 after its low point in June. Mixed Practice dropped a little, from the high point that it had reached last month in more than a year. And the surprise of the month was Institutional, which improved 1.2 points to move back into growth at 50.2. This is the sector’s highest score since December 2011, and it is only the third month since July 2008 that Institutional has seen a score over 50. With all of the federal, state, and local budgets cuts of the past few years, and the continued weakness of the overall economy, it is a little surprising to see this sector growing again.
But if August’s results are an accurate indication, the trend we’ve seen over the past three years appears to be continuing. A growth in billings in the fall, winter, and into the spring, followed by a pullback in billings and work heading into and through the summer. We will be watching to see if this growth in billings continues in the months ahead, and, if so, whether the downward part of the cycle can be broken next summer.
Key August ABI highlights
Regional averages
South: 52.2
West: 51.2
Northeast: 45.5
Midwest: 45.3
Sector index breakdown
Multifamily Residential: 53.0
Institutional: 50.2
Commercial/Industrial: 47.9
Mixed Practice: 46.8